
 0
There are 0 items in your cart: Cart Subtotal: $ 0.00
Fall Undergraduate Enrollment Rose 0.6 Percent While Master's Programs Fell 3.7 Percent and Computer Science Dropped 12 Percent, and Colleges Need a Plan for Each

 The University Marketplace
 0
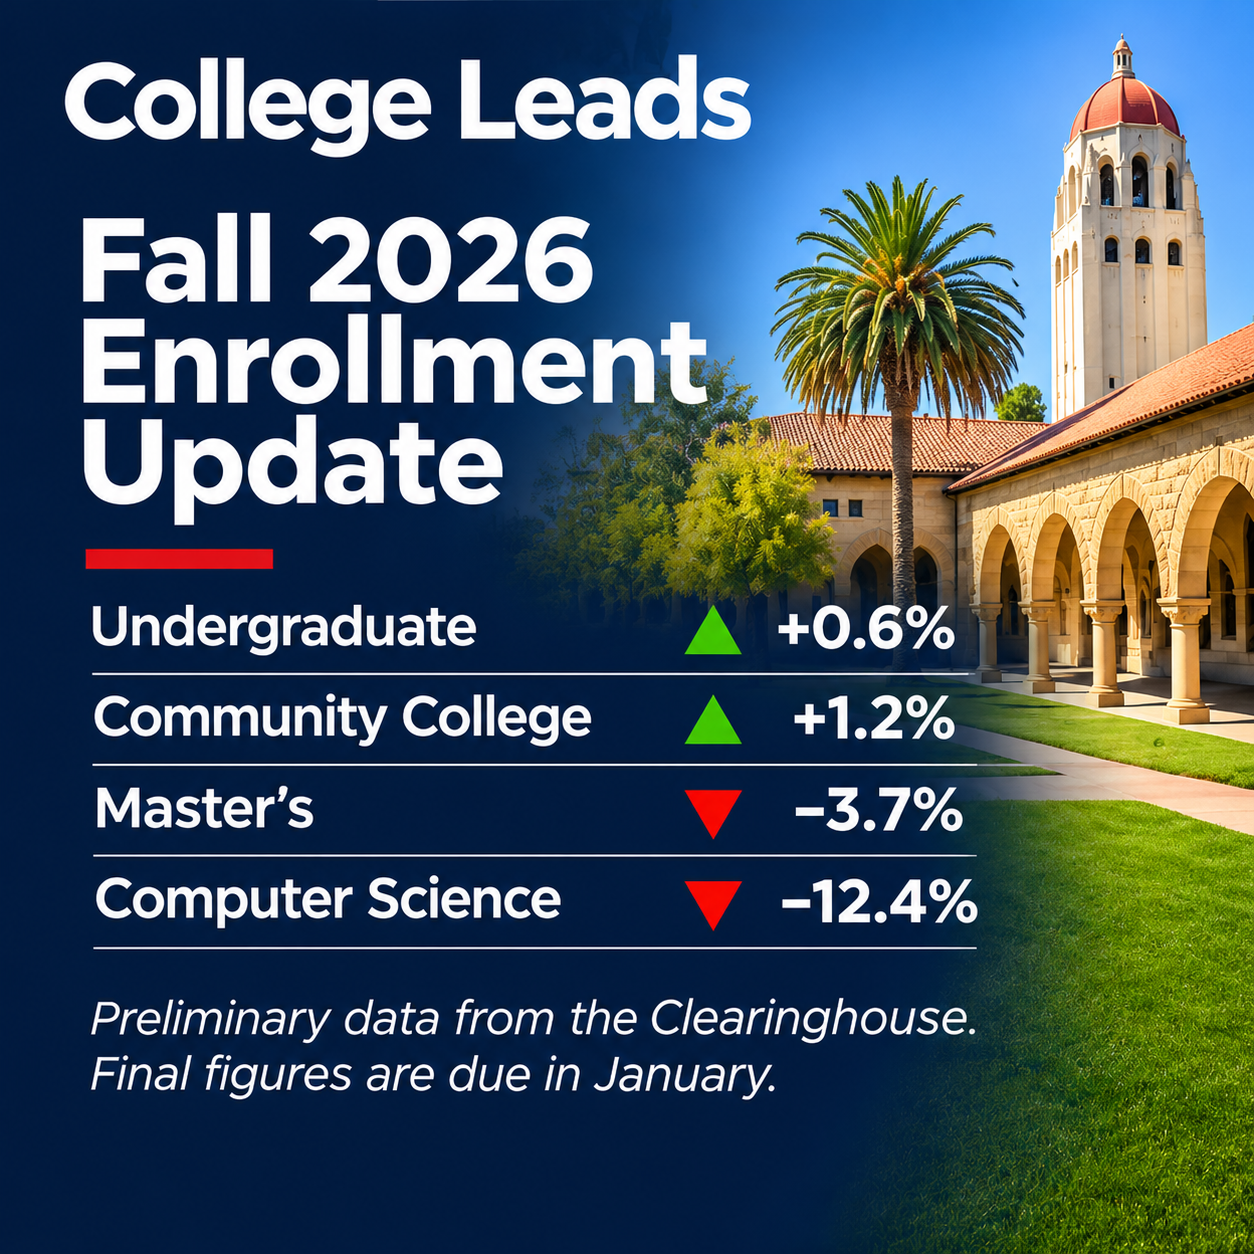
Preliminary Clearinghouse data shows fall 2026 undergraduate enrollment up 0.6 percent, master's down 3.7 percent, and computer science down 12.4 percent. See what it means and how colleges should plan.
Fall Undergraduate Enrollment Rose 0.6 Percent While Master's Programs Fell 3.7 Percent and Computer Science Dropped 12 Percent, and Colleges Need a Plan for Each
The official preliminary numbers from the National Student Clearinghouse are here. Community colleges carried the gain, graduate programs slipped, and the fastest-moving story is inside the majors.
Key Takeaways
- Preliminary National Student Clearinghouse data released October 29, covered by Higher Ed Dive, shows fall 2026 undergraduate enrollment up 0.6 percent, down from a 2.4 percent gain in 2025, with community colleges up 1.2 percent and four-year enrollment roughly flat.
- Graduate enrollment fell 1.6 percent overall and master's enrollment fell 3.7 percent, a much sharper decline than the 0.4 percent dip a year earlier, putting pressure on a key revenue source for many institutions.
- By field, four-year computer science enrollment fell 12.4 percent, the largest drop, while visual and performing arts and liberal sciences each fell more than 4 percent and engineering and health professions each rose more than 6 percent.
- The data is preliminary, covering 46 percent of reporting institutions and 7.9 million enrollments, and final fall 2026 figures are due in January.
The Official Numbers Arrive
Last month, many colleges announced fall headcounts without official national data to compare them against. Now it has arrived. The National Student Clearinghouse Research Center released preliminary fall 2026 enrollment data on October 29, and Higher Ed Dive's Ben Unglesbee reported the results. Overall, undergraduate enrollment rose 0.6 percent this fall, down from a 2.4 percent increase in 2025. Graduate enrollment fell 1.6 percent.
Matthew Holsapple, the Clearinghouse's senior research director, summed up the pattern at a press conference: “The important change this fall isn't widespread decline; it's the loss of that broad-based growth we saw last year.” In plain terms, the recovery is slowing, not reversing.
Growth did not disappear this fall. It narrowed, and it moved to the places where students can see a job.
Community Colleges Led
Community colleges drove the modest overall gain. Their enrollment rose 1.2 percent year over year, following a 3.5 percent increase last fall. Four-year colleges, public and private, stayed roughly flat across credential programs, selectivity categories, and locales. That fits the pattern we have seen in college-reported data, where dual credit and workforce programs have powered growth at many two-year institutions.
It also shows why averages hide the real story. A college that is flat is performing like most four-year institutions. A community college that is up 1.2 percent is matching the national average but may be behind peers in its region. The more useful comparison is a college's own mix of students, programs, and local employers.
The Master's Problem
The sharpest decline is in graduate programs. Master's enrollment fell 3.7 percent, after a 0.4 percent dip in 2025. Holsapple said, “What was a relatively small decline last year has really become more, much more pronounced.” Higher Ed Dive describes master's programs as a critical revenue source for many institutions, which makes the trend a budget issue, not only an enrollment one.
The data does not say why, and the article does not offer a full explanation. Possible factors include cost, changing employer expectations, and students questioning whether an additional credential pays off. Colleges that depend on master's revenue should look closely at their own programs, asking which have stable demand, which are tied to employer reimbursement, and which could be redesigned as shorter, stackable credentials.
When a revenue line shrinks nearly four percent in a year, it is time to ask which programs students would pay for again.
Computer Science Falls Hardest
By field of study, the most striking figure is computer science. Undergraduate enrollment at four-year institutions dropped 12.4 percent, the largest decline among subject areas. Higher Ed Dive links the decline to tech layoffs and automated coding. It cites Federal Reserve Bank of New York figures showing 2024 unemployment of 7 percent for recent computer science graduates and 7.8 percent for computer engineering graduates, roughly 3 points above the overall rate. Holsapple said of the trend, “This year, it's even more pronounced.”
Visual and performing arts and liberal sciences each fell by more than 4 percent. Engineering and health professions each rose by more than 6 percent. The pattern suggests students are leaning toward fields with clear, physical, or licensed career paths, and away from fields where AI is changing entry-level work. It also connects to a recent Gallup and Lumina poll of employers, which found most still value degrees while expecting graduates to work well with AI tools.
What the Fields Tell Colleges
For college leaders, field-level data is the most actionable part of the report. A computer science department facing a drop of this size has choices: refresh the curriculum around AI-assisted development, add applied and cross-disciplinary tracks, strengthen internships, or partner with employers on pathways. Growing programs, such as engineering and health professions, face the opposite challenge, which is capacity. Labs, clinical placements, faculty, and advisors all need to scale.
The deans of engineering and other growing fields are asking for investment. The chief financial officer and provost have to decide whether to fund growth in one area while another shrinks, and the vice president of enrollment management has to decide where to market. These choices work best when they use the same data.
Reading the Data With Care
The Clearinghouse data is preliminary. It covers 46 percent of institutions that report to the Clearinghouse and includes 7.9 million enrollments, and final fall 2026 data is scheduled for release in January. The article does not cover dual enrollment, international students, age groups, or certificate-level enrollment, all areas where individual colleges may look different. Leaders should treat the figures as a guide for planning and wait for the final data before drawing firm conclusions.
A Five-Step Response
Colleges can act now with a simple plan. First, compare your own fall numbers with the national pattern, by level and by field, to see where you are ahead or behind. Second, list your five largest master's programs and examine applications, yield, and employer demand. Third, review computer science and any other program with a sharp decline, and decide whether to redesign, partner, or reduce. Fourth, identify programs with waitlists and calculate what added capacity would cost. Fifth, brief the cabinet and trustees with one page of numbers, so decisions rest on shared facts.
The workforce thread is strong. In our look at the waitlists at Utah technical colleges, demand for career-linked programs exceeded capacity. The new national data suggests that pattern is widening.
Who Needs to Be in the Room
These decisions cross the institution. The college president and the provost set priorities and academic direction. The vice president of enrollment management and the director of admissions manage recruitment and conversion. The dean of graduate studies owns master's programs, and the dean of engineering and other deans manage growth and decline in their fields. The director of institutional research supplies data, and the chief financial officer turns trends into budgets.
Questions Trustees Will Ask
Trustees who read the national numbers will ask direct questions. How do our fall results compare with the national picture? Which of our graduate programs are shrinking, and what is the revenue effect? What are we doing in computer science? Which programs are growing, and can we serve the demand? What are we assuming about next fall? Leaders who can answer with current figures show that the college is managing change on purpose.
Why the Field Shift Matters for Marketing and Recruiting
Field-level movement changes where colleges should spend recruiting dollars. If students are drifting toward engineering and health professions, then campaigns that highlight those programs, their clinical or lab experiences, and their employer outcomes are likely to find an audience. Programs in decline need a different message, one that shows how the curriculum has changed in response to employer needs and AI tools.
Prospective students and families also read the same headlines. A story about computer science graduates facing 7 percent unemployment shapes how a high school junior thinks about majors. Colleges that publish their own placement, internship, and salary results give those students something concrete to weigh.
What Graduate Programs Can Do
A 3.7 percent decline in master's enrollment gives graduate deans a reason to act before the next cycle. Programs can shorten time to degree, add stackable certificates that lead into a master's, offer more flexible scheduling for working adults, and work with employers on tuition support. They can also review marketing: how many inquiries become applications, and how many admitted students enroll.
Programs that serve one regional industry may be the most resilient, since they can build direct employer relationships. Programs that compete in a crowded national online market face more pressure, and may need to differentiate or consolidate.
Community Colleges: Keep the Momentum
A 1.2 percent gain after 3.5 percent last fall suggests two-year colleges are still growing, though more slowly. The institutions best placed to keep growing are those that tie programs to local hiring, offer clear transfer pathways, and make enrollment easy for working adults and high school students. Those are the same themes that surfaced throughout fall reporting, and the national data supports them.
Leaders should also watch capacity. Strong demand in health and technical programs can outrun lab space and instructors. A waitlist is a signal to invest, not only a problem to manage.
Budget Scenarios to Run Now
With final data due in January, finance teams can prepare three simple scenarios for spring. In the first, enrollment holds at the fall level. In the second, master's enrollment falls another few points next year while undergraduate enrollment stays flat. In the third, a strong program such as nursing or engineering adds sections and grows. Comparing the revenue and cost of each shows where flexibility exists and where a decision cannot wait.
Leaders should also separate headcount from credit hours and net tuition revenue. A college can be flat in headcount and still see revenue pressure if students take fewer credits or receive more aid. Institutional research can provide these views, and a shared one-page summary keeps trustees and cabinet members working from the same numbers.
A Note on Reading Headlines
National numbers are averages, and few colleges are average. Regional demographics, program mix, and local employers can make an institution's year look very different from the national picture. Use the Clearinghouse report as a benchmark, not a verdict, and compare your results against peers of similar type and region whenever the data allows.
Signals to Watch
Several developments are worth following: the final Clearinghouse data in January, whether master's declines spread beyond preliminary figures, whether computer science enrollment stabilizes after curriculum changes, how international and dual enrollment look when reported, and whether the community college gain holds as the demographic cliff approaches. Each will show whether this fall was a pause or a turn.
College Leads maintains college email lists, a higher education contact list, and university mailing lists built around the enrollment and budget buying committee, including a college president email list, a provost email list, a vice president of enrollment management email list, a dean of graduate studies email list, a director of admissions email list, a director of institutional research email list, a chief financial officer email list, and a dean of engineering email list. These are the higher ed decision makers who will shape enrollment strategy this year. If you are ready to buy college email list data, or want a higher education marketing database by role and institution type, build your list here while colleges are planning spring recruitment and next fall.
Frequently Asked Questions
Did college enrollment go up in fall 2026?
Slightly. Preliminary National Student Clearinghouse data released October 29 shows undergraduate enrollment up 0.6 percent, down from 2.4 percent in 2025, with community colleges up 1.2 percent. Graduate enrollment fell 1.6 percent.
Why is computer science enrollment dropping?
Four-year computer science enrollment fell 12.4 percent, the largest decline among fields. Higher Ed Dive links it to tech layoffs and automated coding, citing Federal Reserve Bank of New York data showing 7 percent unemployment for recent computer science graduates in 2024.
Who leads enrollment planning at a college?
The vice president of enrollment management and the director of admissions lead recruitment, with the provost, deans, director of institutional research, and chief financial officer shaping programs, data, and budgets.